A Pool Data Miner is created in the Reports folder by clicking + New/Pool Data Miner. With a pool data miner, the sum of all quantitative values from a pool data field is queried and displayed as a pie chart or bar chart.
In this example, the values from the Industry field (multiple selection field) are queried and the system displays how often the different values are present in the pool. It is possible to query the entire pool or the value distribution within a target group.
In addition to a simple query, you can nest a query. This means that two or more fields are queried. In this example, the field industry is queried first and the field Salutation is queried additionally. Please note the order in the configuration.
This way you get the values in two levels. In the first view, you see the value distribution in the Industry field. By clicking on the pie segment Services, the values from the profiles are now displayed, which have the value Service and the split values from the field Form of Salutation, in this case the distribution of Mr, Mrs and Company.
Report Pool Data Miner
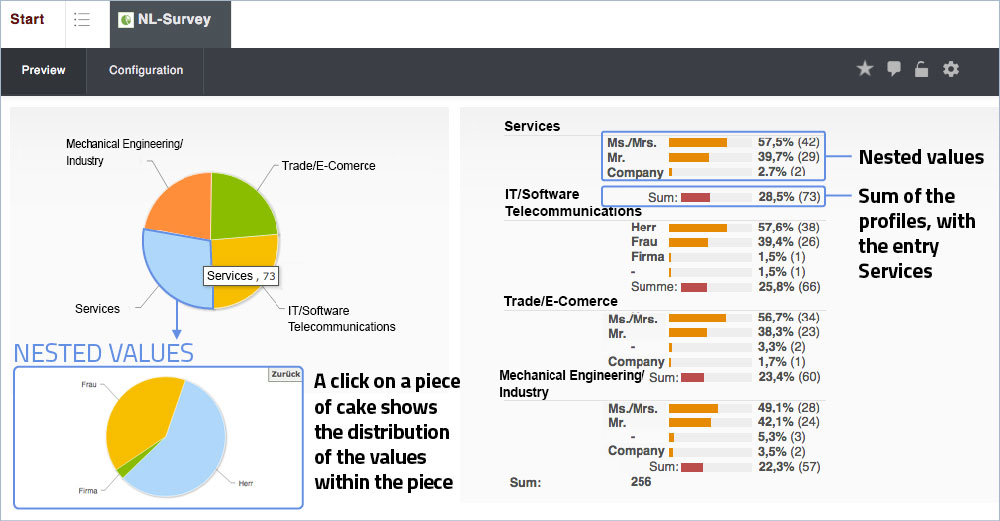
The pool data miner represents the quantitative distribution of values from one or more data fields.
Configuration
Under the navigation tab Configuration, you can change the name, select the pool or target group and specify the fields to be queried.
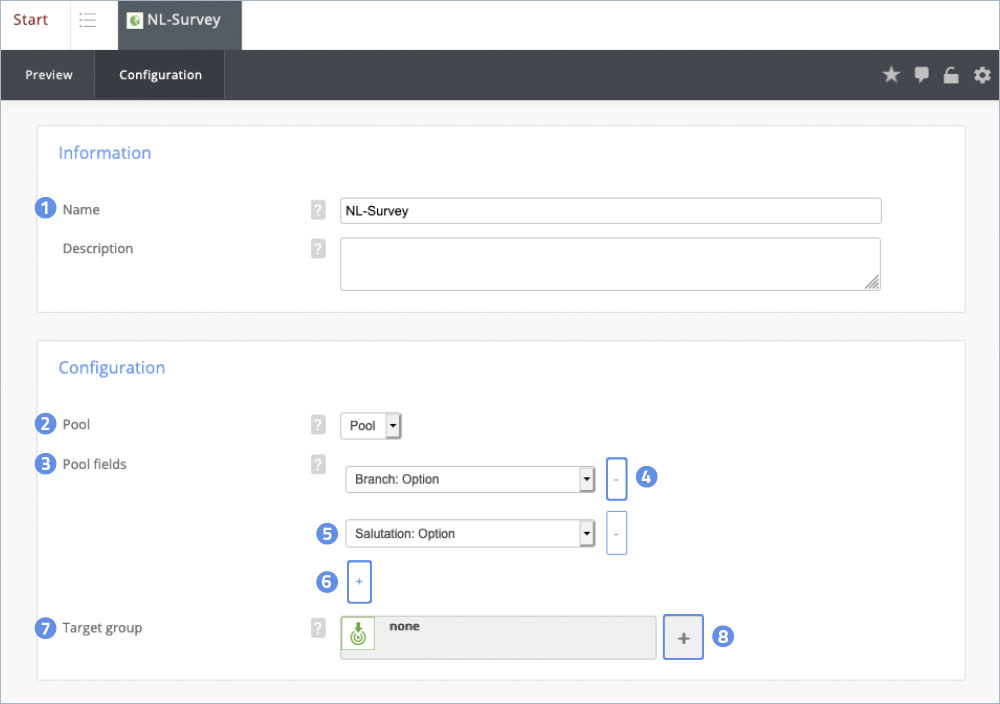
Under Configuration, one or more fields can be entered for a query.
- Enter name for the pool data miner
- Enter pool for the query
- Enter first field for query
- Remove field
- Enter nested field for the query
- Add a field for a nested query
- Enter the target group for the query
- Create new target group
The following field types are supported:
Single and multiple selection fields
Number fields with:
- value (e.g. 1, 3, 39, 204)
- Range in tens (e.g. 0-9, 30-39, 200-209)
- Range in hundreds (e.g. 0-99, 200-299)
- Range in thousands (e.g. 0-999)
eMail address with domain
Date input
- month and year (e.g. 04/2012, 05/2012)
- month (e.g. 04, 06, 12)
- Day of the month (e.g. 25, 31)
- Day of the week (e.g. Monday, Friday)
Reporting API
In addition to the SOAP interface, this API offers the possibility to process statistical, tracking and scoring data. This data can be integrated, evaluated and visualized in Business Intelligence solutions and dashboards, for example.